Code
import matplotlib.pyplot as plt
plt.plot([1,23,2,4])
plt.show()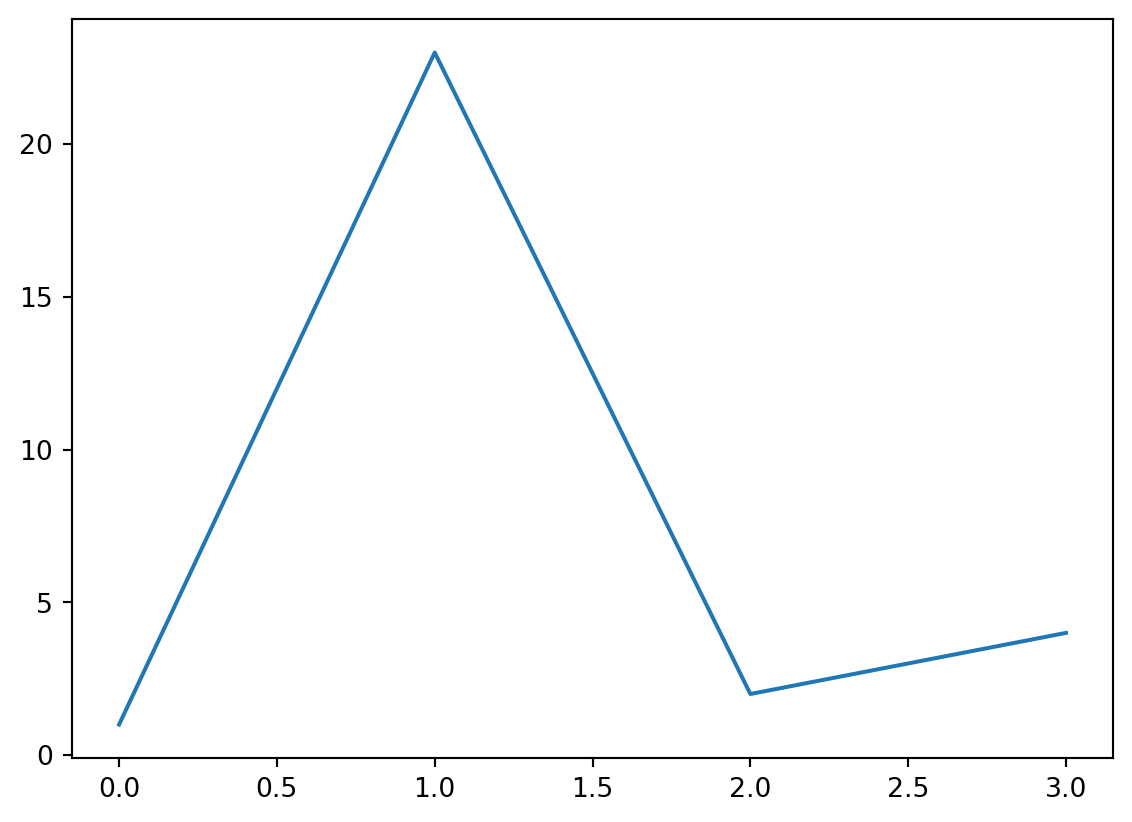
See Figure 1 in Section 2 for a demonstration of a simple plot.
See Equation 1 to better understand standard deviation.
See Section 4 for a demonstration of code annotations.
import matplotlib.pyplot as plt
plt.plot([1,23,2,4])
plt.show()\[ s = \sqrt{\frac{1}{N-1} \sum_{i=1}^N (x_i - \overline{x})^2} \tag{1}\]
penguins, and then,
Here is a footnote reference,1 and another.2
This paragraph won’t be part of the note, because it isn’t indented.
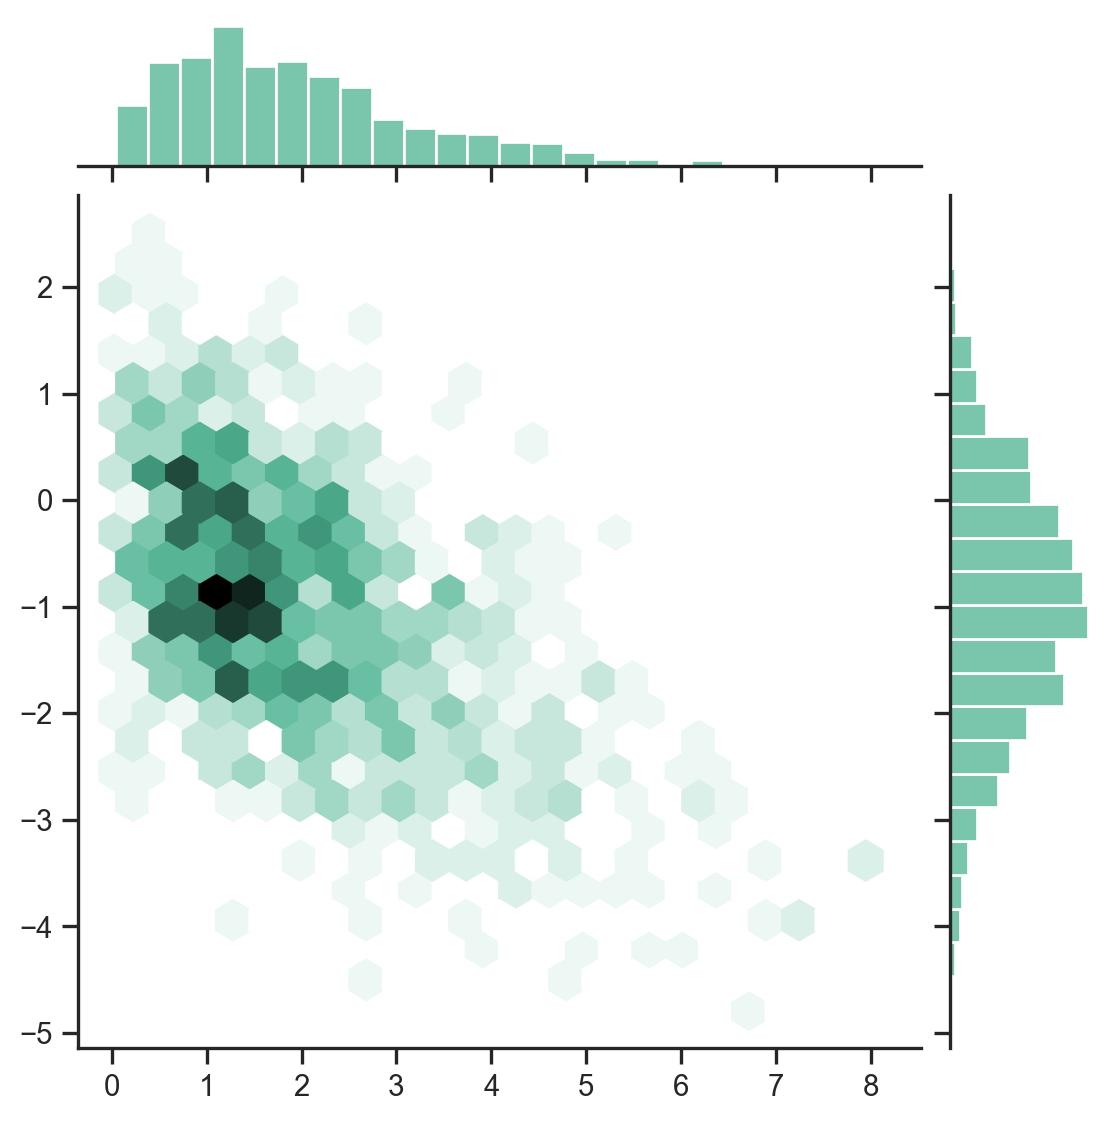
import numpy as np
import seaborn as sns
import matplotlib.pyplot as plt
sns.set_theme(style="ticks")

rs = np.random.RandomState(11)
x = rs.gamma(2, size=1000)
y = -.5 * x + rs.normal(size=1000)

sns.jointplot(x=x, y=y, kind="hex", color="#4CB391")
plt.show()